26 entries

Catalogue

Specifications, registers, models and assessments. An assignment can involve one or several of these.

Specifications

01

Event model ↗

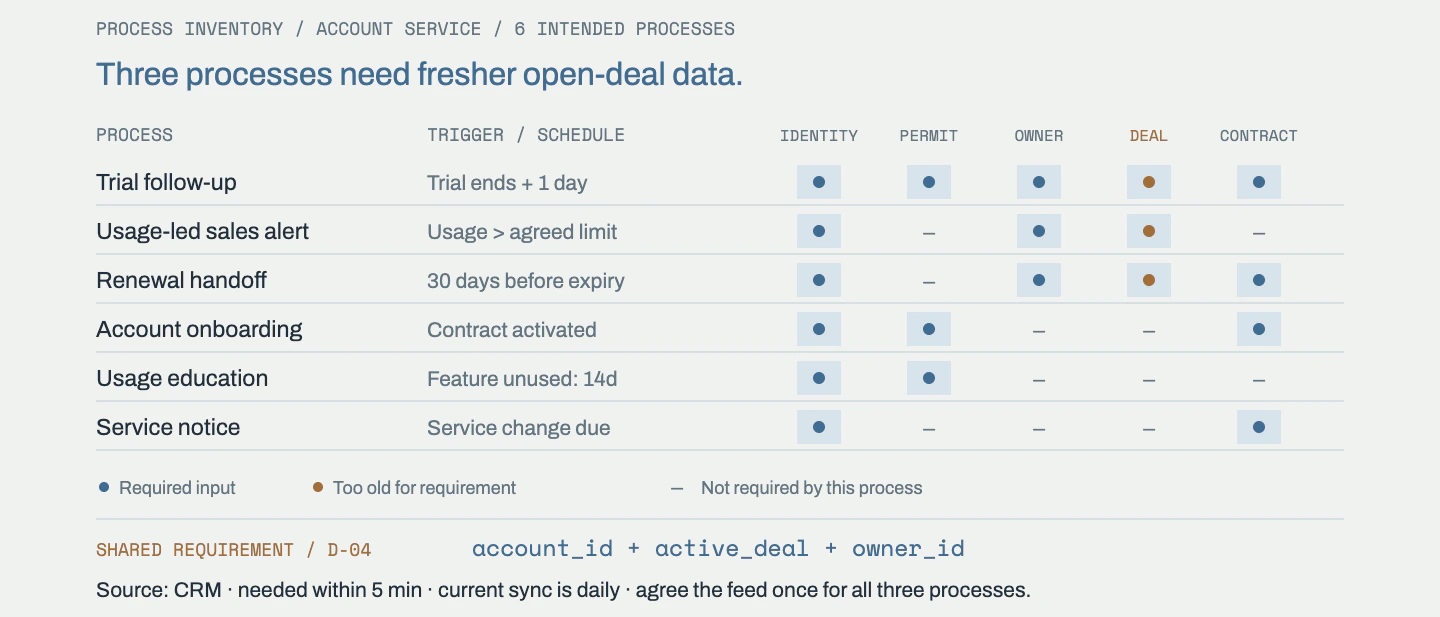
A specification of the events recorded by the systems in scope.
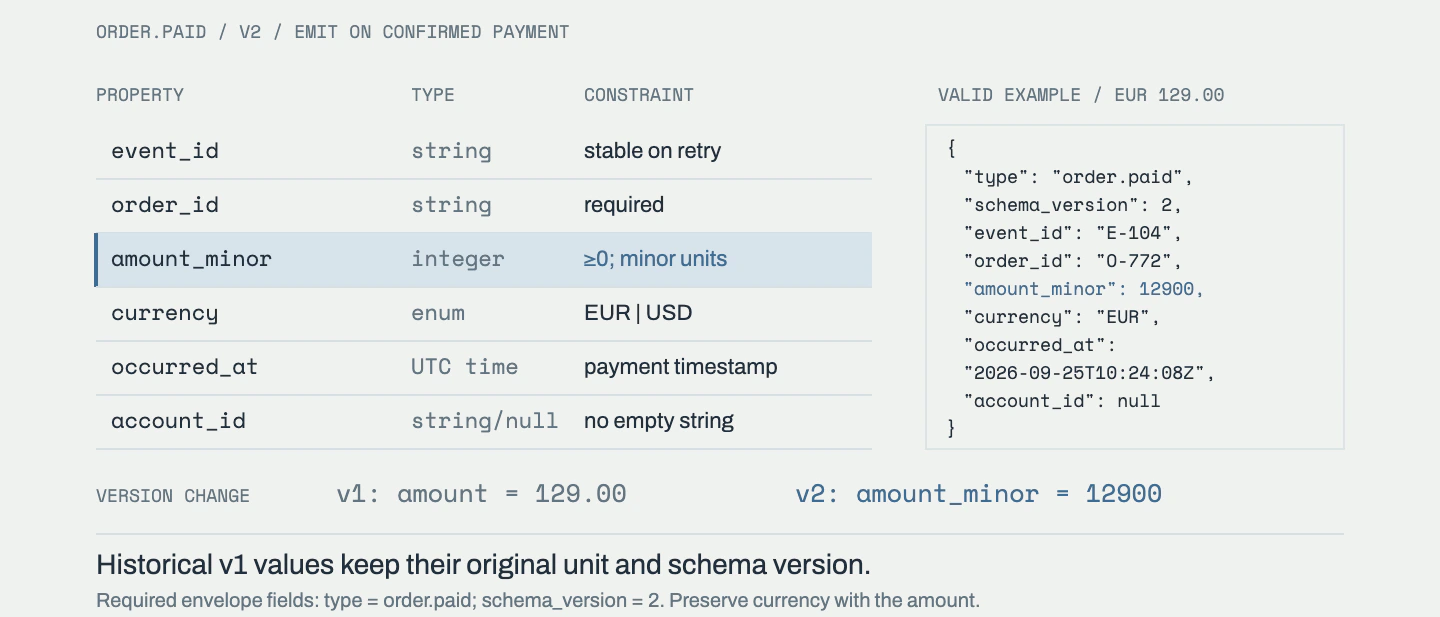
An order-paid event schema and valid example define required fields and minor currency units while preserving the meaning of historical version-one values.
Illustrative example · constructed informationFull specimen ↗
Output

An event specification with definitions, example records and change rules.

02

Identity model ↗

How records are matched to a person, account or other entity across systems.
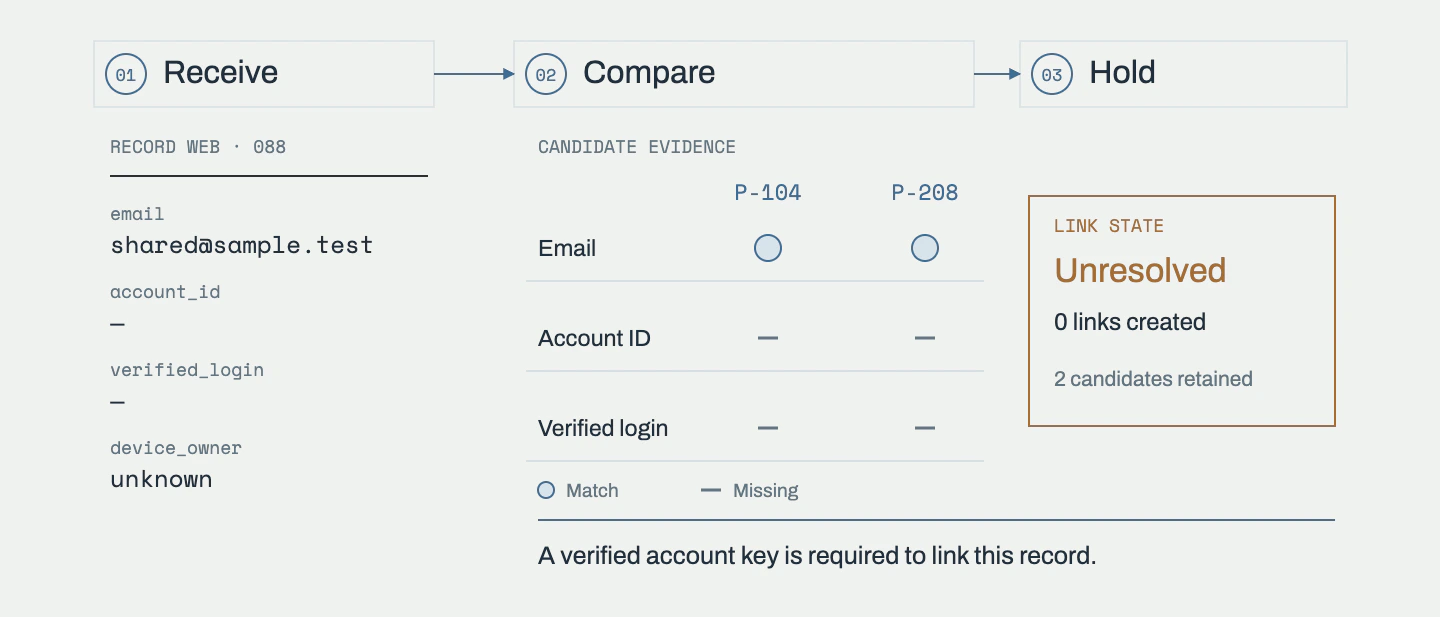
An email-only record produces two candidates and remains unresolved because a verified account key is missing.
Illustrative example · constructed informationFull specimen ↗
Output

Matching rules, entity definitions and a description of how links and corrections affect historical records.

03

Consent and permissions ↗

Rules for recording consent and applying changes across the systems that use it.
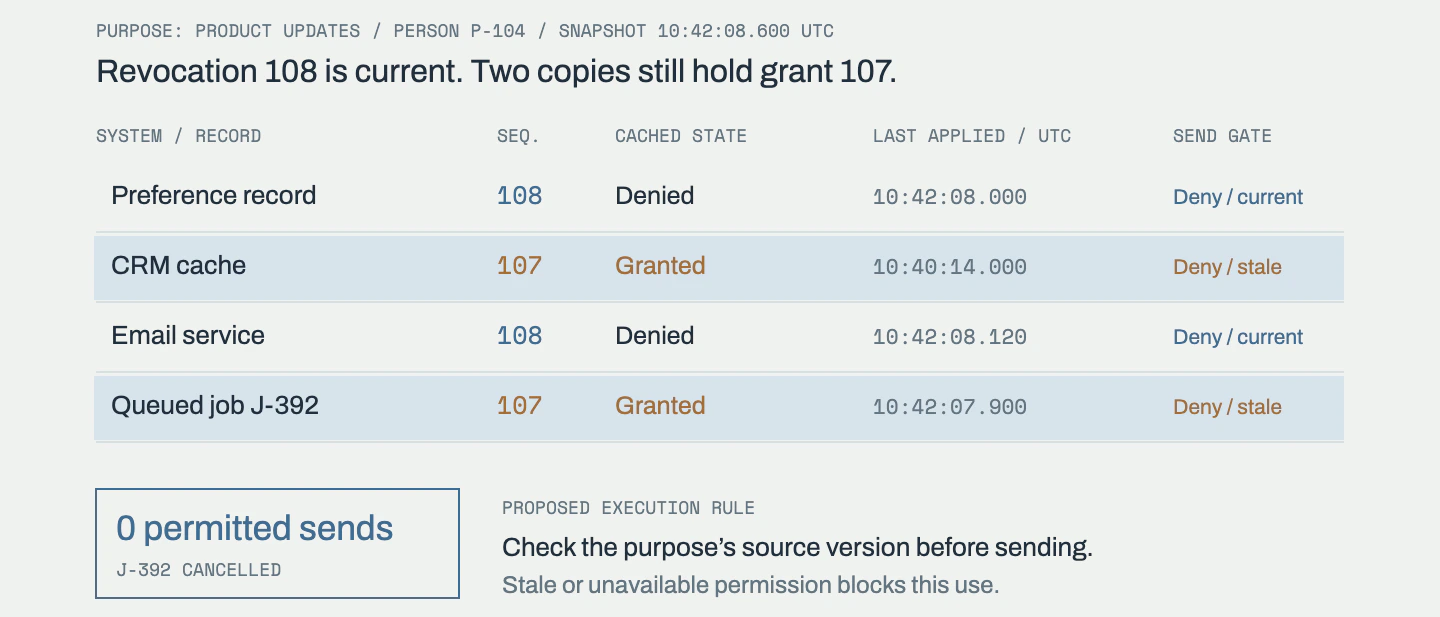
A purpose-specific revocation is current while two cached copies still show an old grant; the proposed send gate blocks every send and cancels the queued job.
Illustrative example · constructed informationFull specimen ↗
Output

A specification of consent states, permitted uses, update paths and unresolved decisions.

04

Collection and routing ↗

Where each event is captured, how it is checked and which systems receive it.
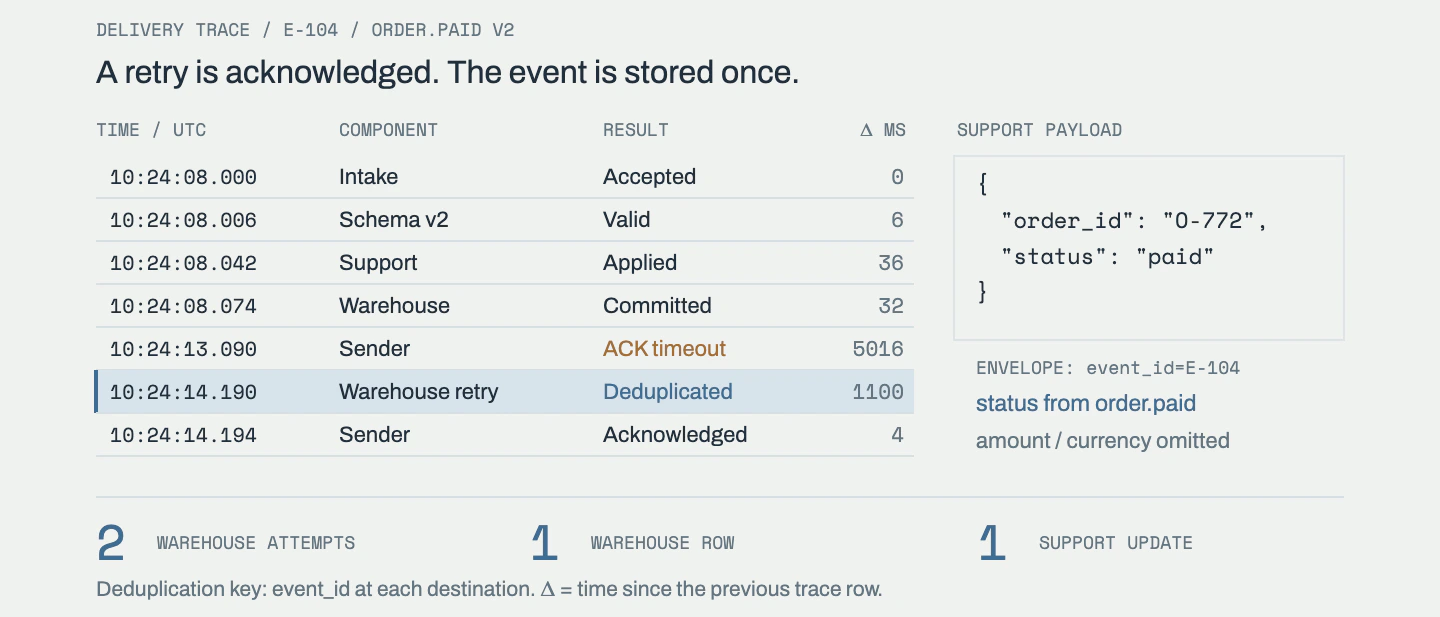
A constructed trace shows a warehouse commit followed by an acknowledgement timeout and a deduplicated retry; the support payload forwards only order ID and derived paid status.
Illustrative example · constructed informationFull specimen ↗
Output

A routing specification with checks, transformations, timing requirements and failure handling.

05

Funnel design ↗

The stages from first contact to customer, with the criteria and handoffs between them.
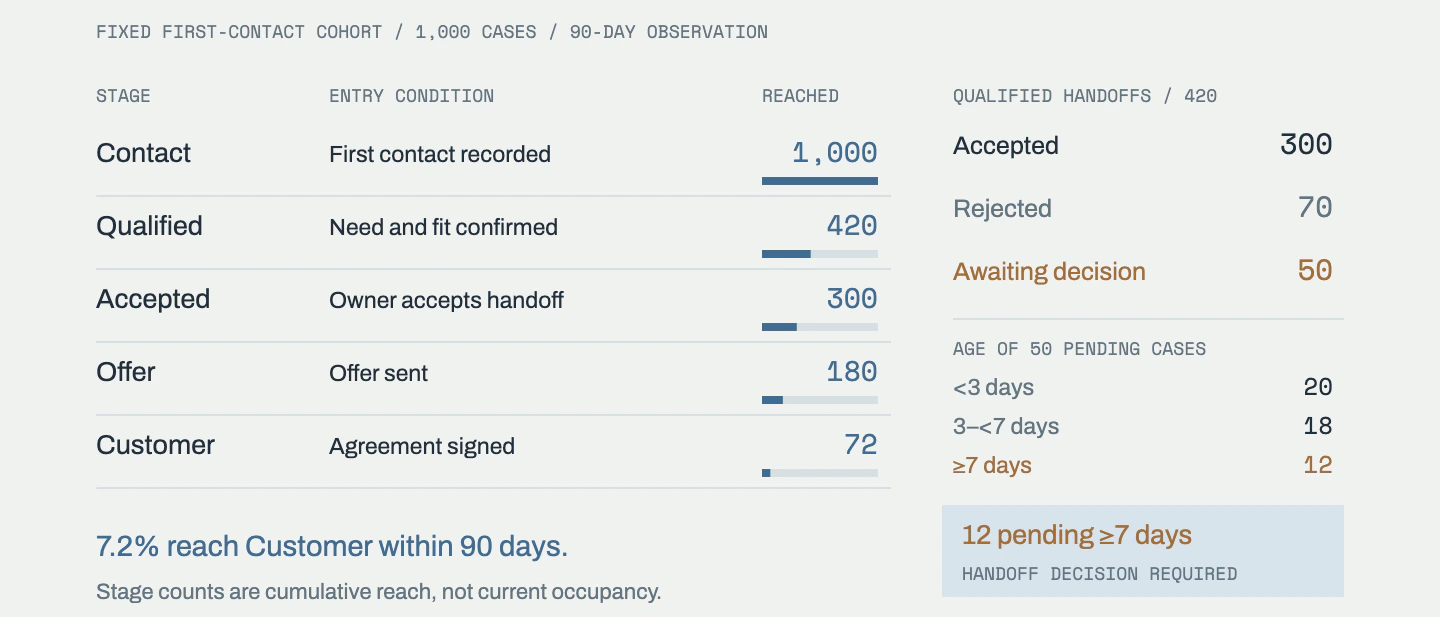
A 1,000-case cohort has defined stage criteria and cumulative reach; 420 qualified handoffs reconcile to 300 accepted, 70 rejected and 50 pending, of which 12 meet the seven-day limit.
Illustrative example · constructed informationFull specimen ↗
Output

A stage specification and the definitions needed to measure movement through it.

06

Workflow and automation design ↗

How a process should run across people and systems, including the decisions and exceptions.
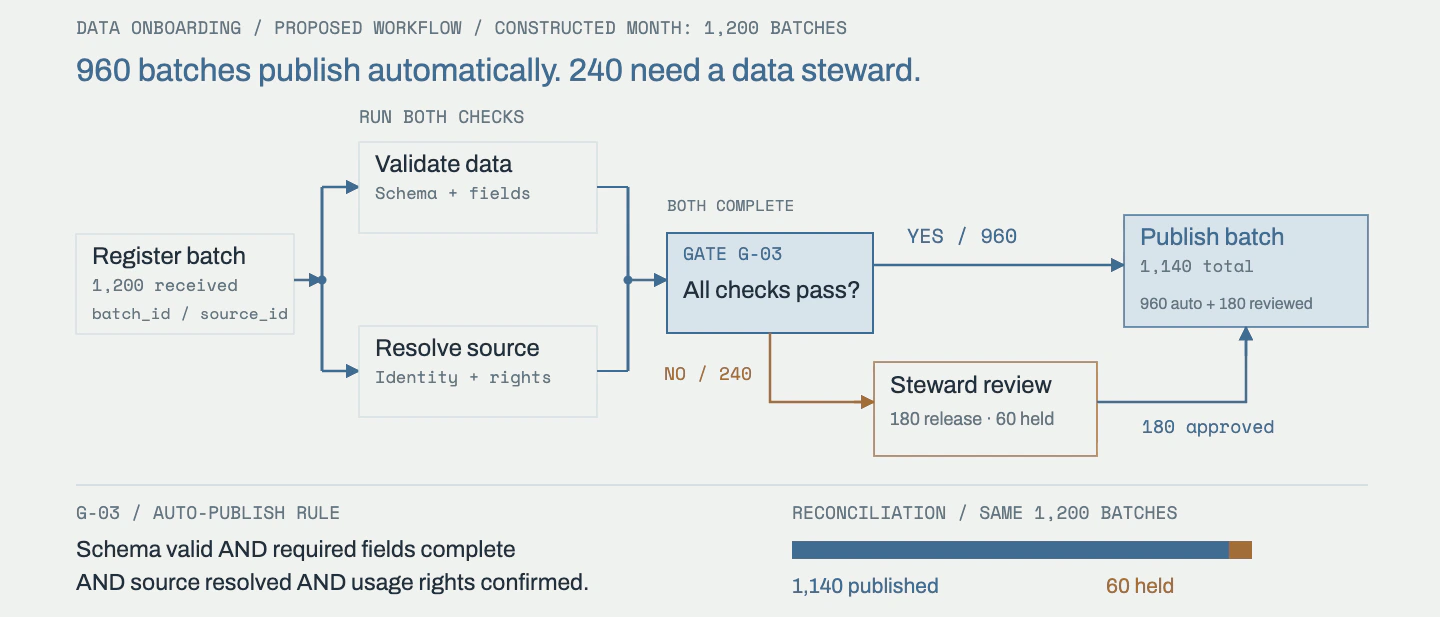
A data-onboarding workflow checks schema and source permissions in parallel, automatically publishes 960 batches and sends 240 to a steward. The steward releases 180 and holds 60, reconciling to 1,200 inputs.
Illustrative example · constructed informationFull specimen ↗
Output

A workflow specification with responsibilities, access requirements, approval rules and exception paths.

07

Sales pipeline definitions ↗

Sales opportunity stages and the definitions used to report on the pipeline.
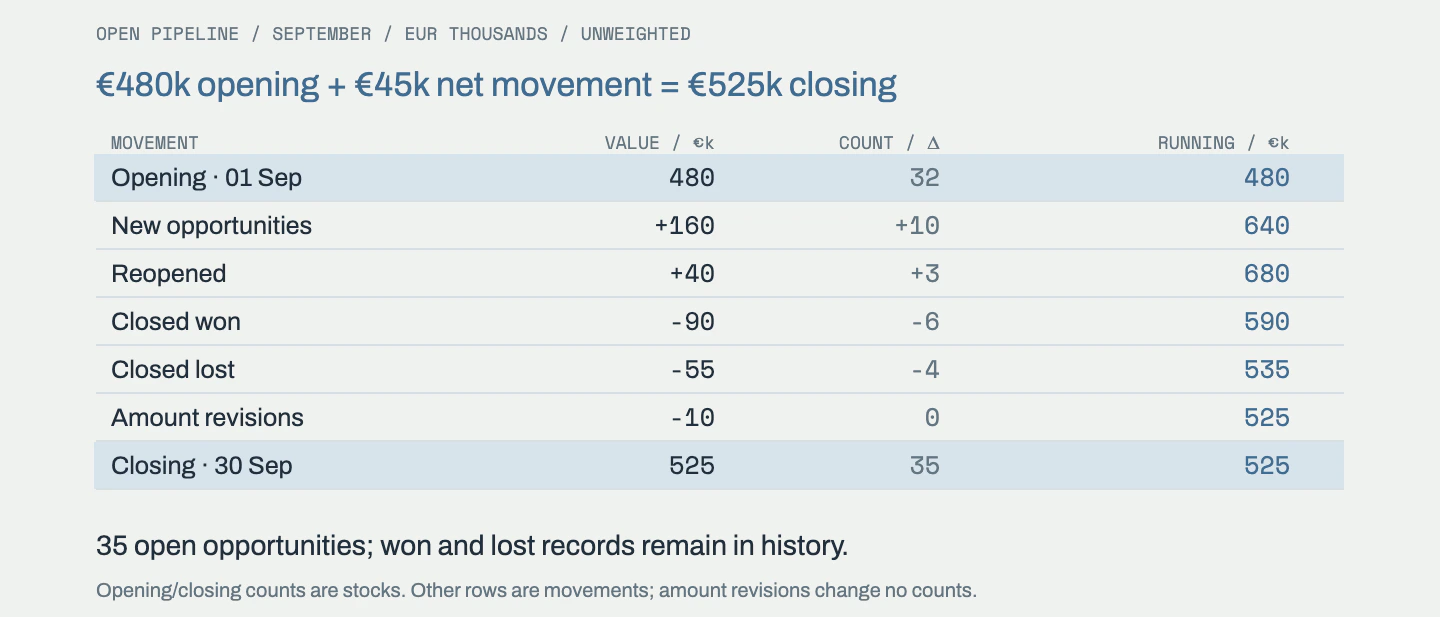
Opening and closing opportunity values reconcile through new, reopened, won, lost and revised amounts, with a separate count reconciliation.
Illustrative example · constructed informationFull specimen ↗
Output

A sales pipeline specification covering stage rules, history and reporting definitions.

08

Lead routing and ownership ↗

Rules for assigning leads and handling records that need reassignment or review.
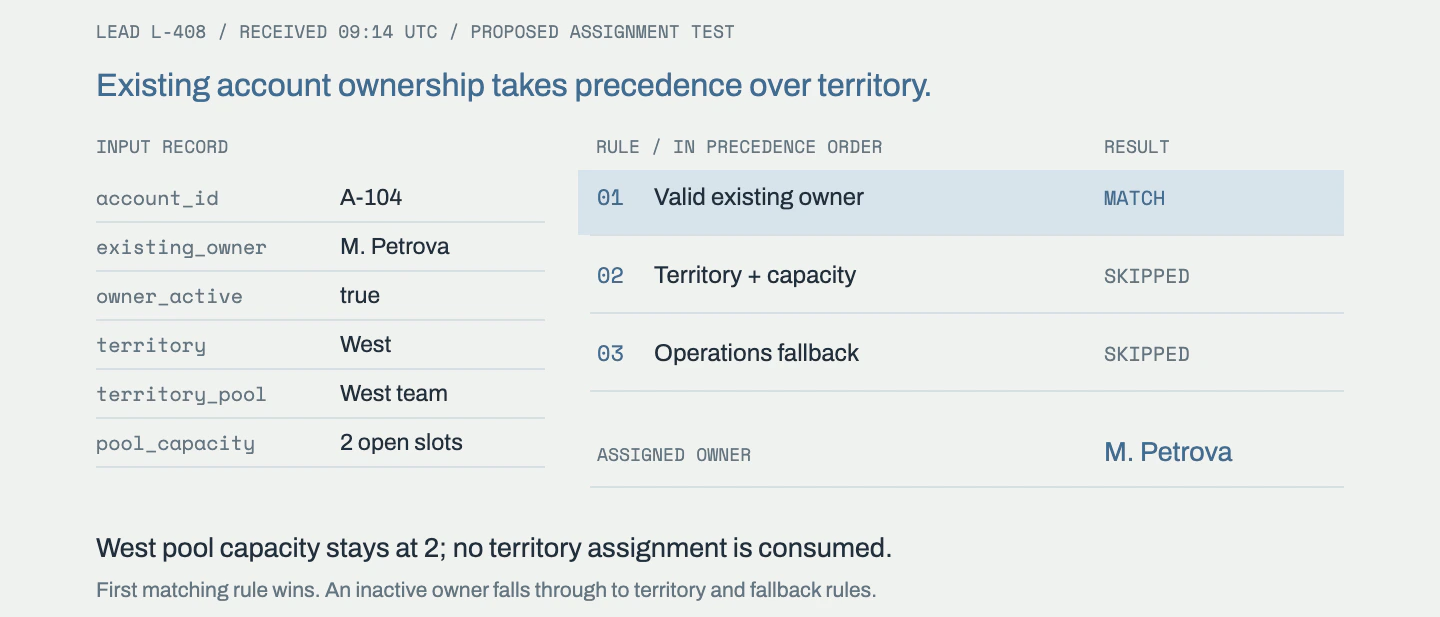
A lead matches an existing account owner and a territory pool. Ordered rules retain the active owner without consuming territory capacity.
Illustrative example · constructed informationFull specimen ↗
Output

A routing decision table with ownership, reassignment and exception rules.

09

Product data model ↗

Definitions for products, packages and versions, and how their records relate across systems.
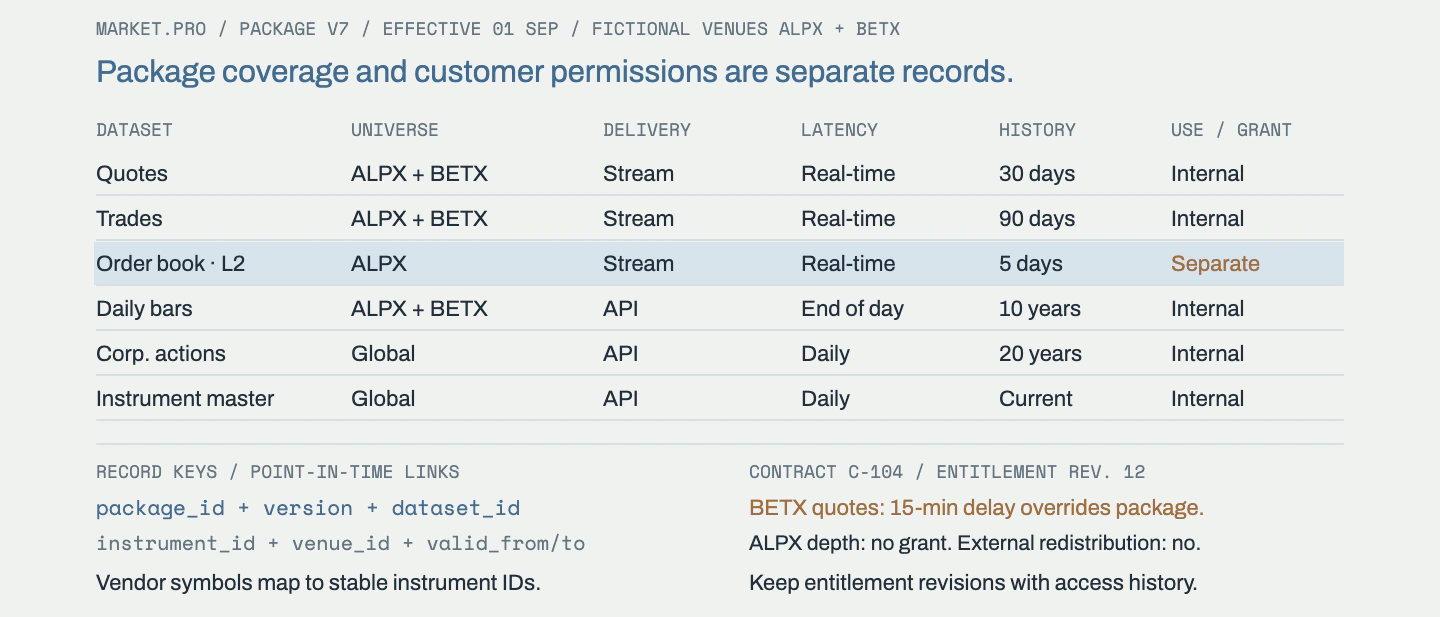
A versioned market-data package defines six datasets, venue coverage, delivery, latency and history. A separate contract limits effective quote latency and depth access.
Illustrative example · constructed informationFull specimen ↗
Output

A product data specification with identifiers, attributes, package relationships, access terms and change rules.

10

Data preparation for AI ↗

Organising data and documents so they can be used for a defined AI task.
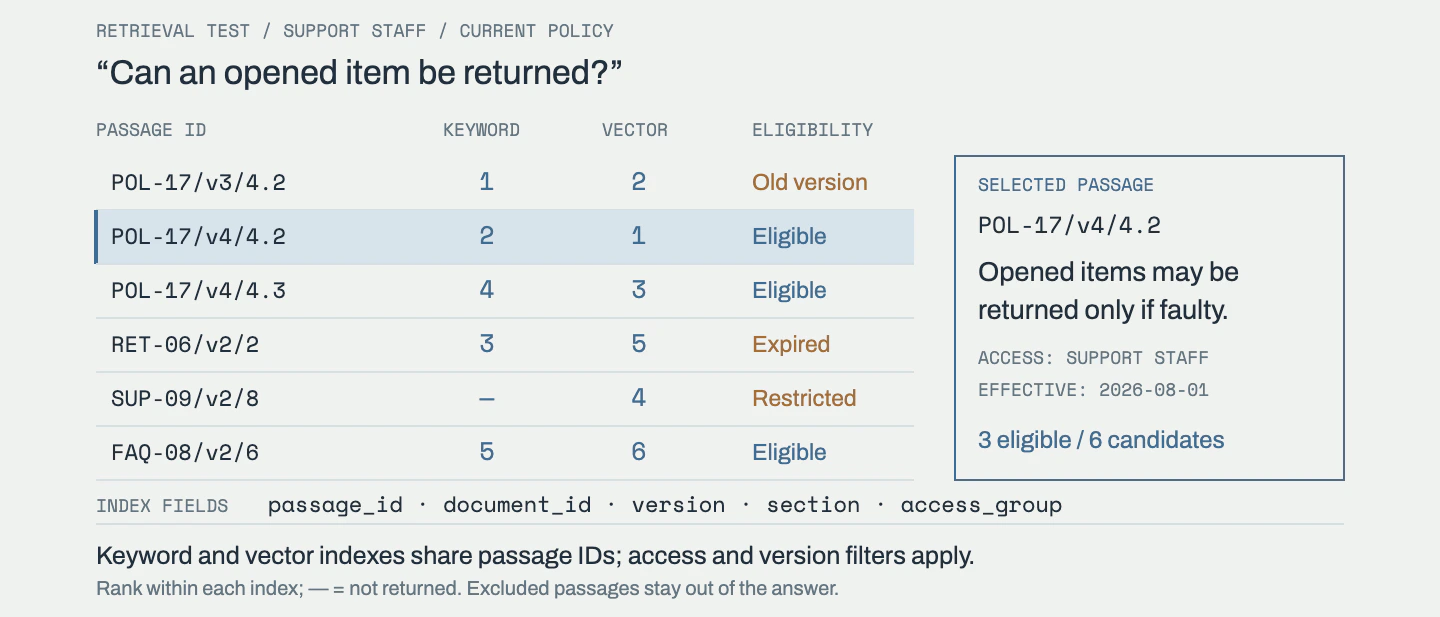
Keyword and vector index candidates are joined by passage ID; three of six remain eligible after version, expiry and access checks, with the current policy passage selected.
Illustrative example · constructed informationFull specimen ↗
Output

A preparation specification covering source structure, indexes and retrieval checks, with organised source material where included in the assignment.

Registers

12

Measurement plan ↗

Definitions and source requirements for the measures used in a particular part of the business.
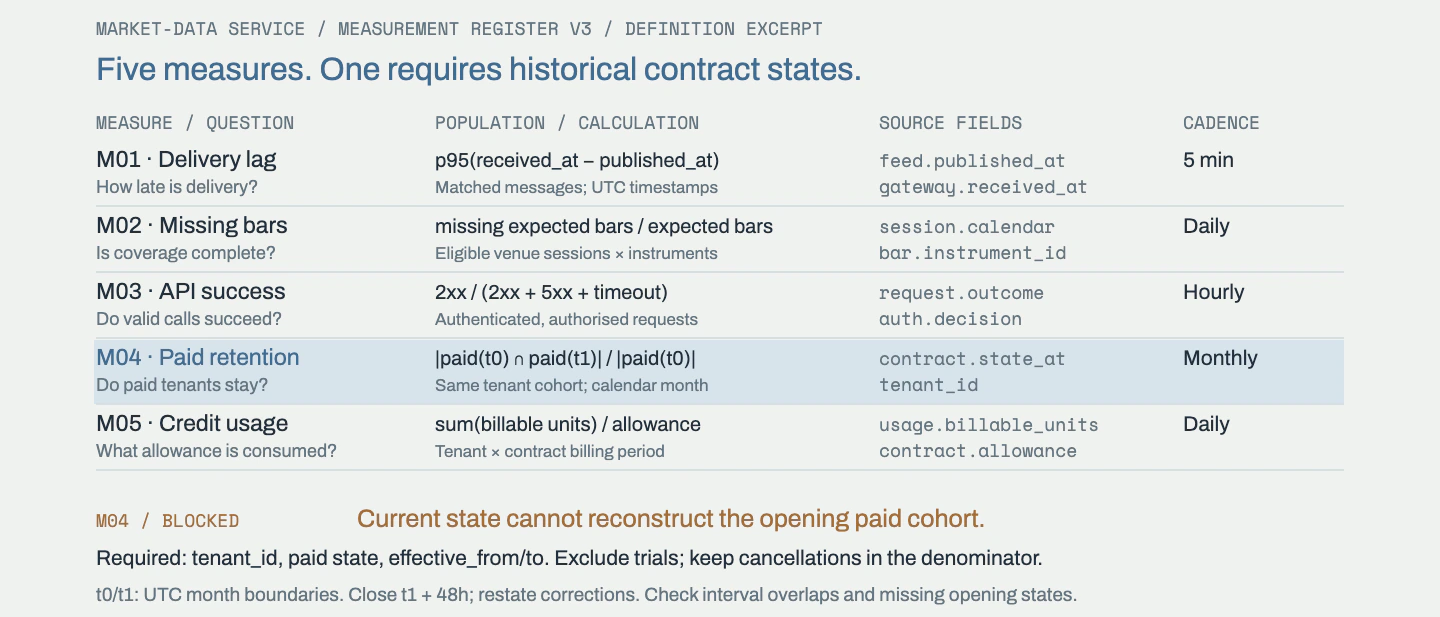
A five-measure specification records questions, populations, formulas, source fields and cadence. Paid retention is blocked until historical contract intervals are available.
Illustrative example · constructed informationFull specimen ↗
Output

A register of measures, calculations, source requirements and interpretation notes.

14

Data requirements ↗

The information needed for an analysis, process, prediction or AI application.
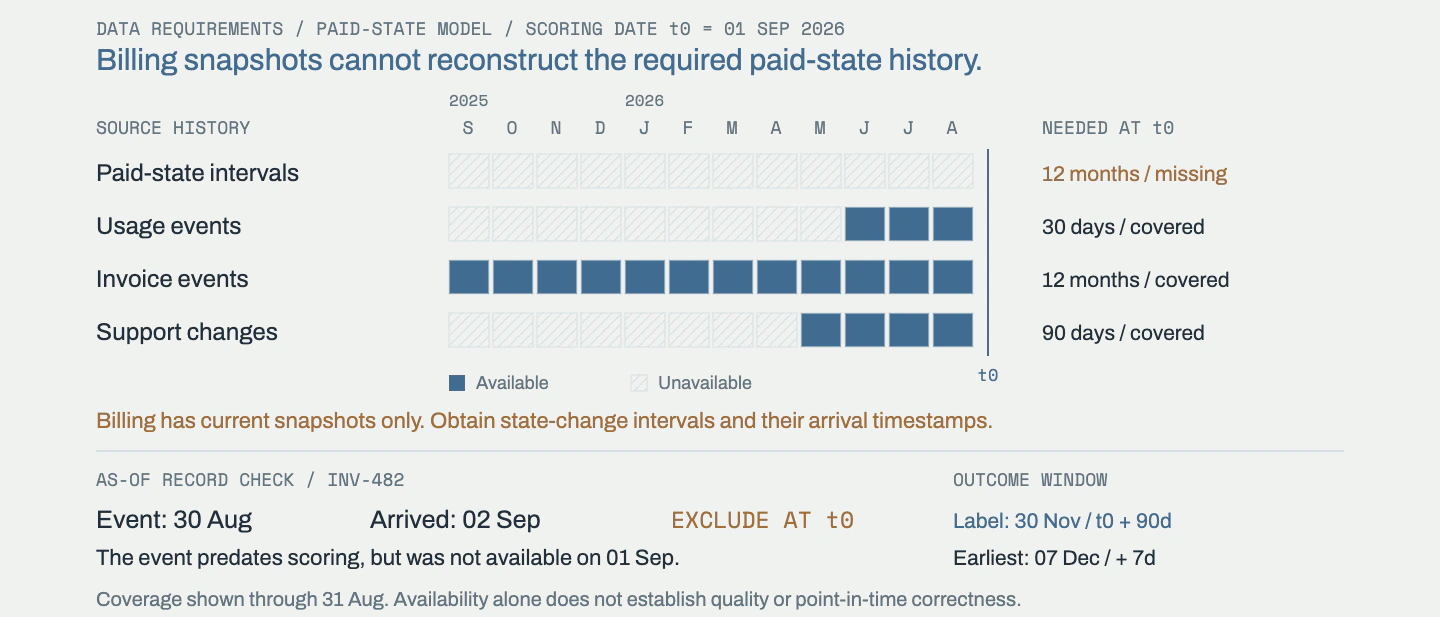
A twelve-month coverage chart separates available source history from missing paid-state intervals. A late invoice record is excluded from scoring, while the future label requires ninety days plus seven days of settling.
Illustrative example · constructed informationFull specimen ↗
Output

A requirements register linking each use to its data, source, timing and quality conditions.

Models

15

Customer value models ↗

Calculations of realised and expected customer value over a defined period.
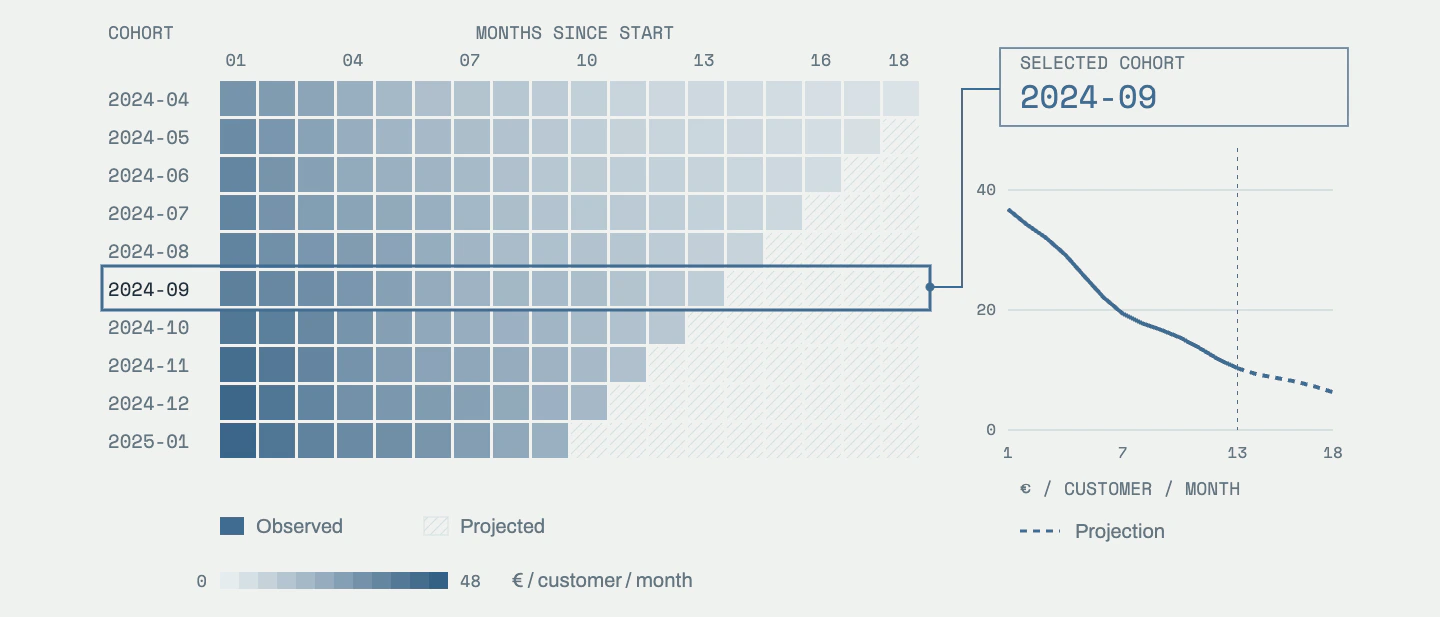
Cohort contribution matrix with one cohort linked to its monthly contribution curve.
Illustrative example · constructed informationFull specimen ↗
Output

A customer value model with its components, horizon, assumptions and sensitivity analysis.

16

Predictive models ↗

Models that estimate future outcomes, behaviour or timing from available data.
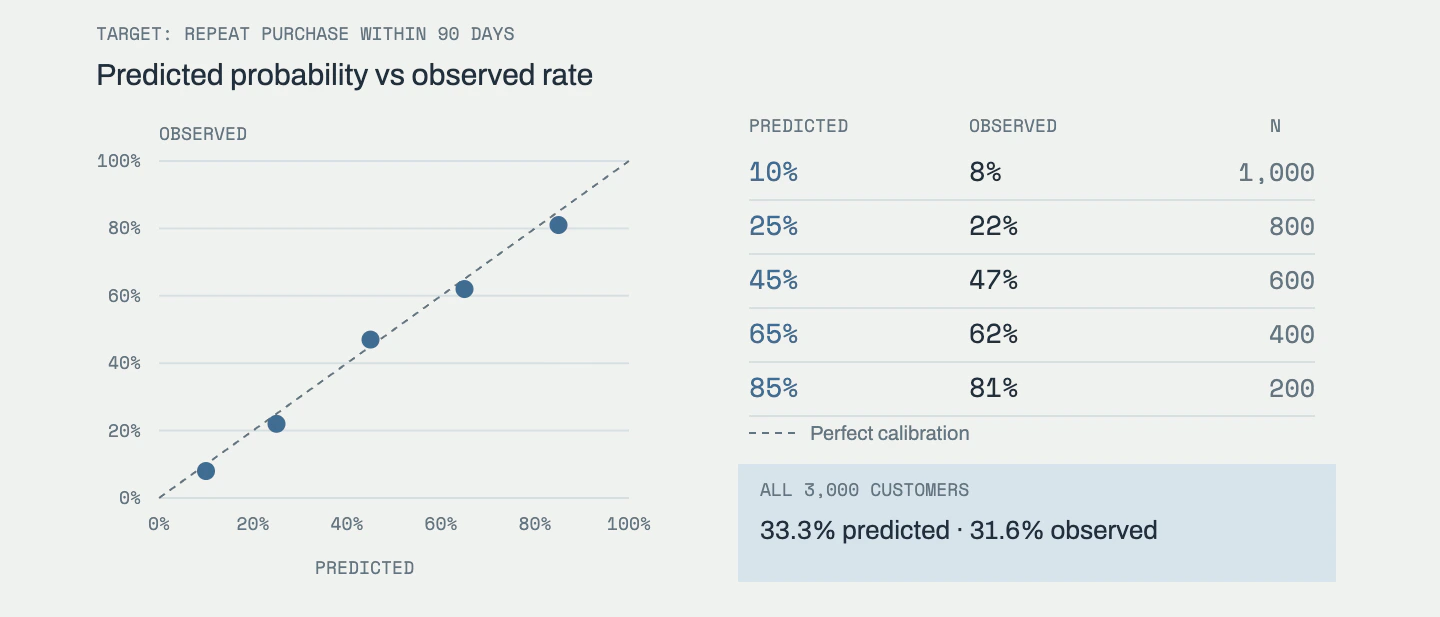
Five fixed probability groups compare predictions with complete 90-day outcomes for 3,000 fictional customers in a later holdout cohort.
Illustrative example · constructed informationFull specimen ↗
Output

An analytical model and evaluation, with the assumptions and requirements for its proposed use.

17

Segmentation models ↗

Definitions of groups and behavioural states for analysis or operational use.
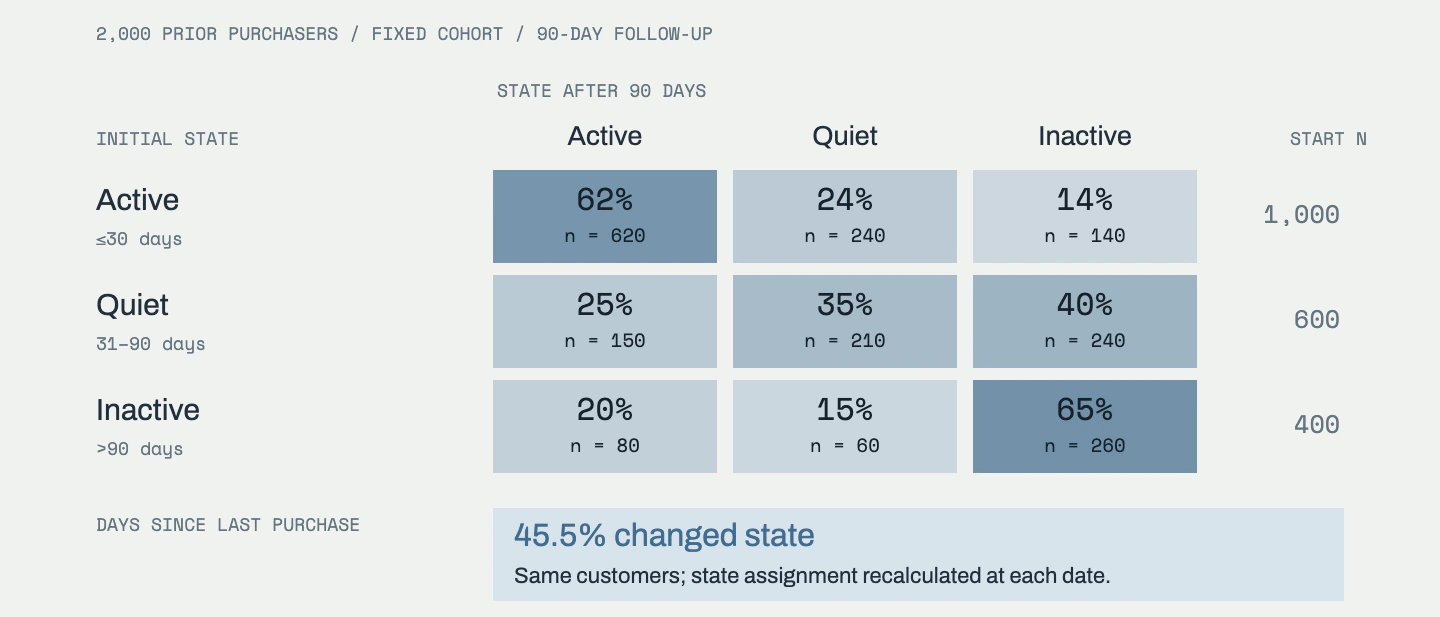
A fixed cohort of 2,000 customers moves between recency states over 90 days; each row sums to 100%, and 45.5% change state.
Illustrative example · constructed informationFull specimen ↗
Output

Segment definitions, an assignment method and an analysis of their differences and stability.

18

Attribution models ↗

Models that assign credit for an outcome to recorded interactions.
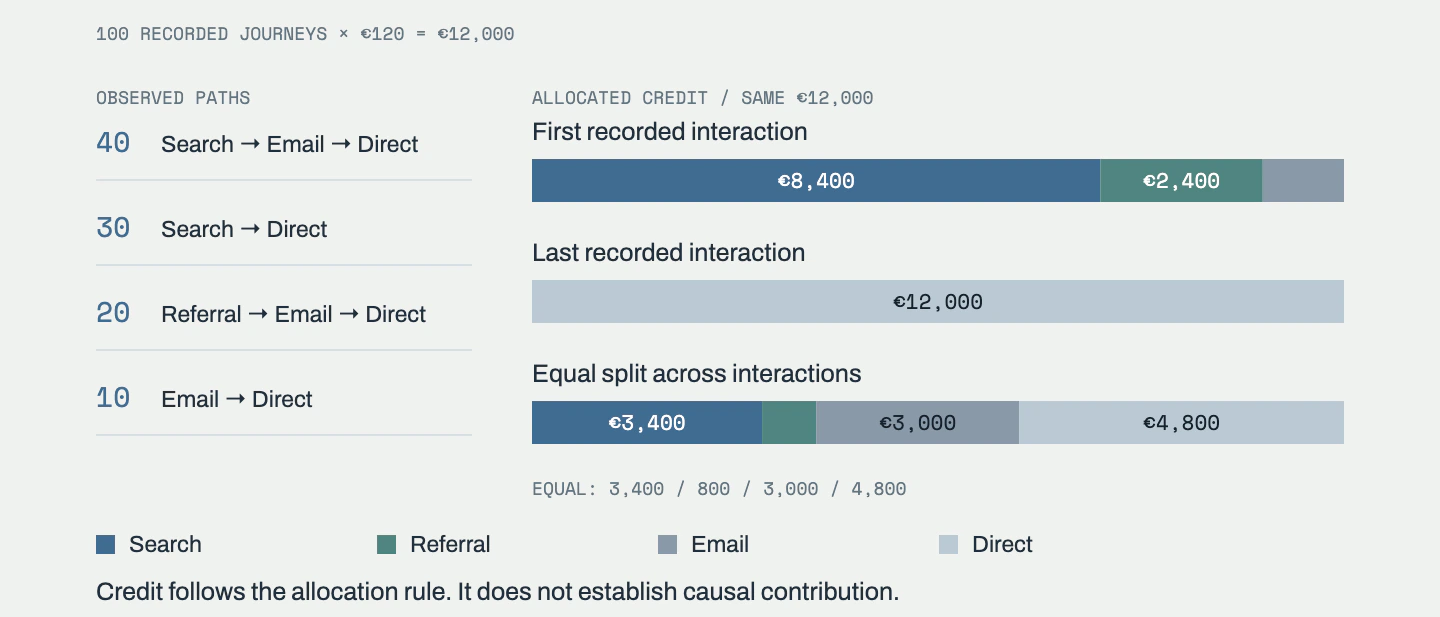
The same 100 journeys and €12,000 are allocated by first interaction, last interaction and equal split; all three methods conserve the same total.
Illustrative example · constructed informationFull specimen ↗
Output

An attribution model with method comparisons and interpretation limits. Allocated credit alone does not establish causal effect.

19

Volume and cost models ↗

Estimated data volumes and operating costs under different usage and system choices.
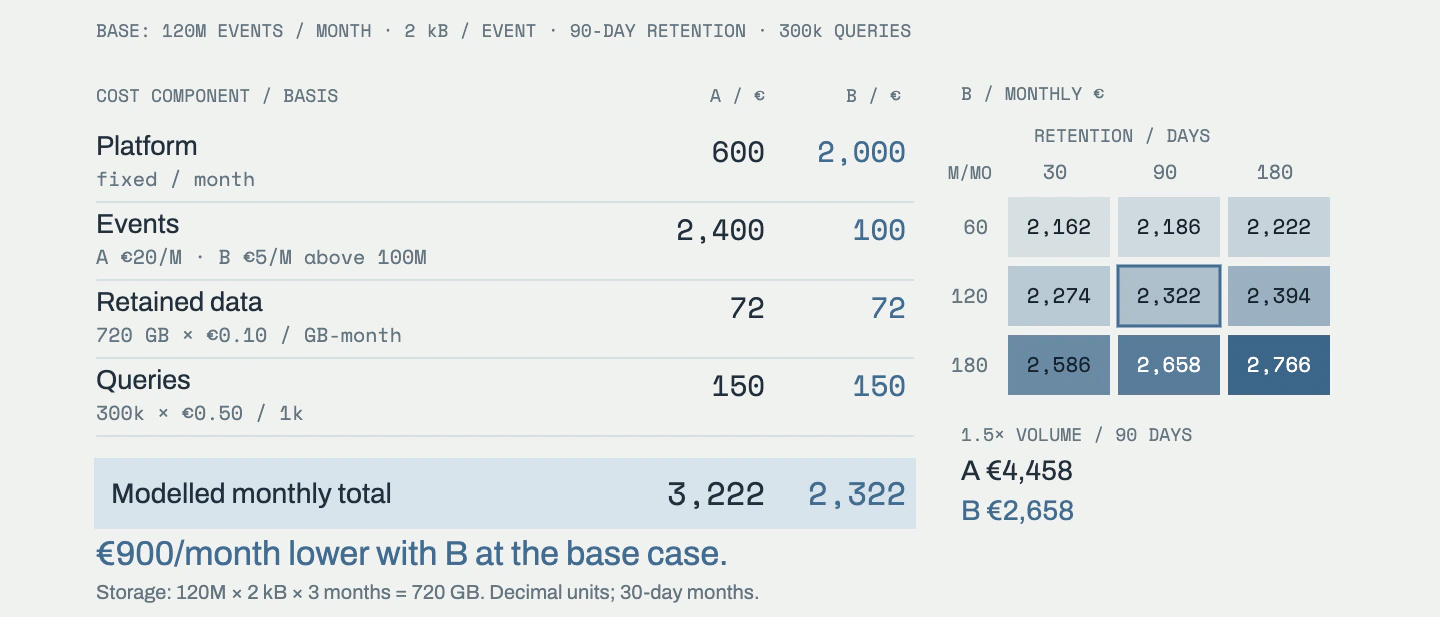
A monthly cost sheet combines event charges, retained data and queries; the €3,222 versus €2,322 base case is checked against volume and retention sensitivity.
Illustrative example · constructed informationFull specimen ↗
Output

A volume and cost model with scenario comparisons, pricing assumptions and sensitivity to uncertain inputs.

20

Decision models ↗

Rules and calculations used to rank options, select an action or assign a resource.
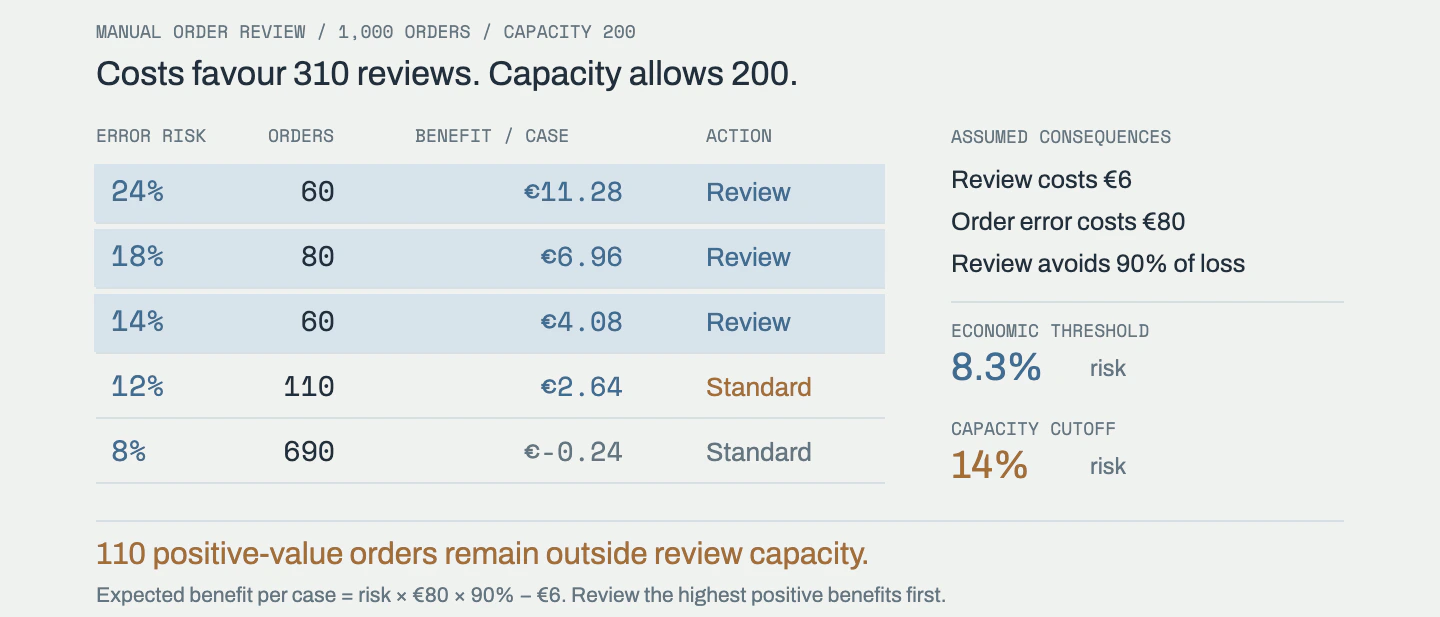
Expected loss and review cost make 310 cases economically eligible, but capacity of 200 selects the three highest-risk groups and leaves 110 positive-benefit cases on the standard path.
Illustrative example · constructed informationFull specimen ↗
Output

A decision model with rules, thresholds, example cases and review conditions.

21

Process simulation ↗

A model of how work moves through a process under different conditions.
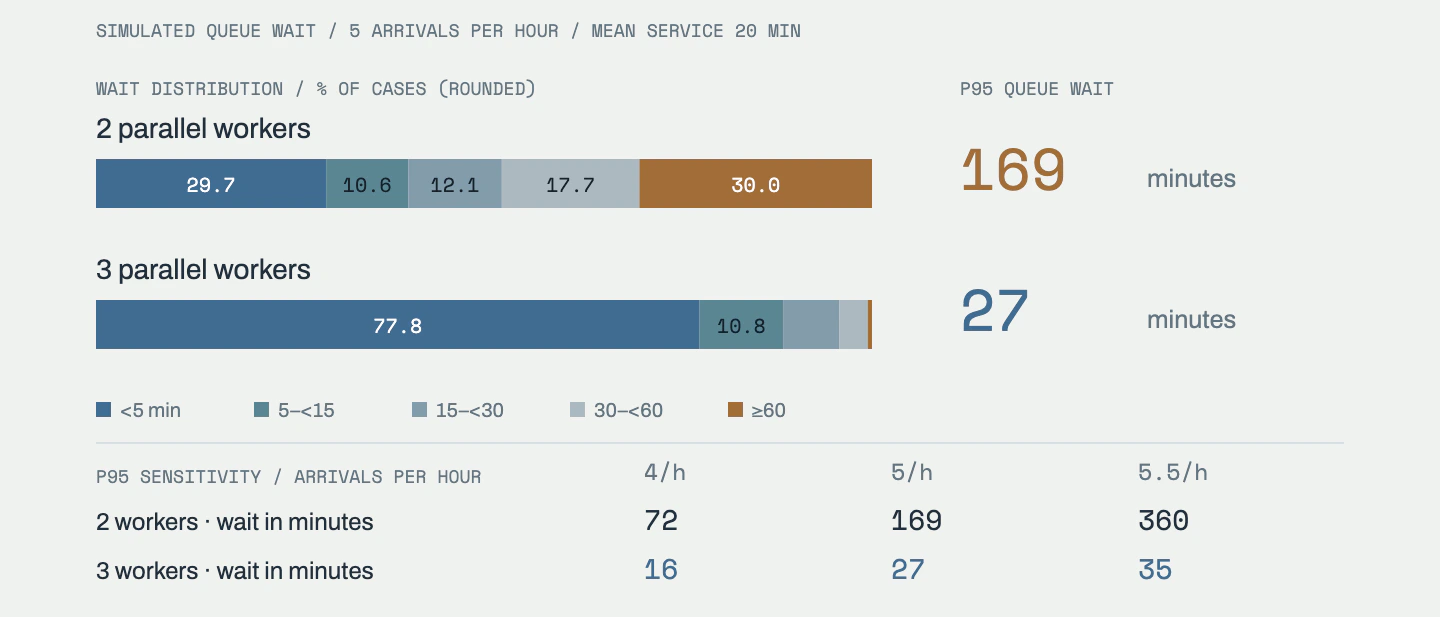
Paired queue simulations compare two and three workers under identical arrivals and service durations, with waiting distributions and sensitivity to arrival rate.
Illustrative example · constructed informationFull specimen ↗
Output

A simulation and scenario analysis showing modelled capacity, waiting times or other relevant outcomes.

22

Optimisation models ↗

Models that compare feasible allocations or schedules against a defined objective.
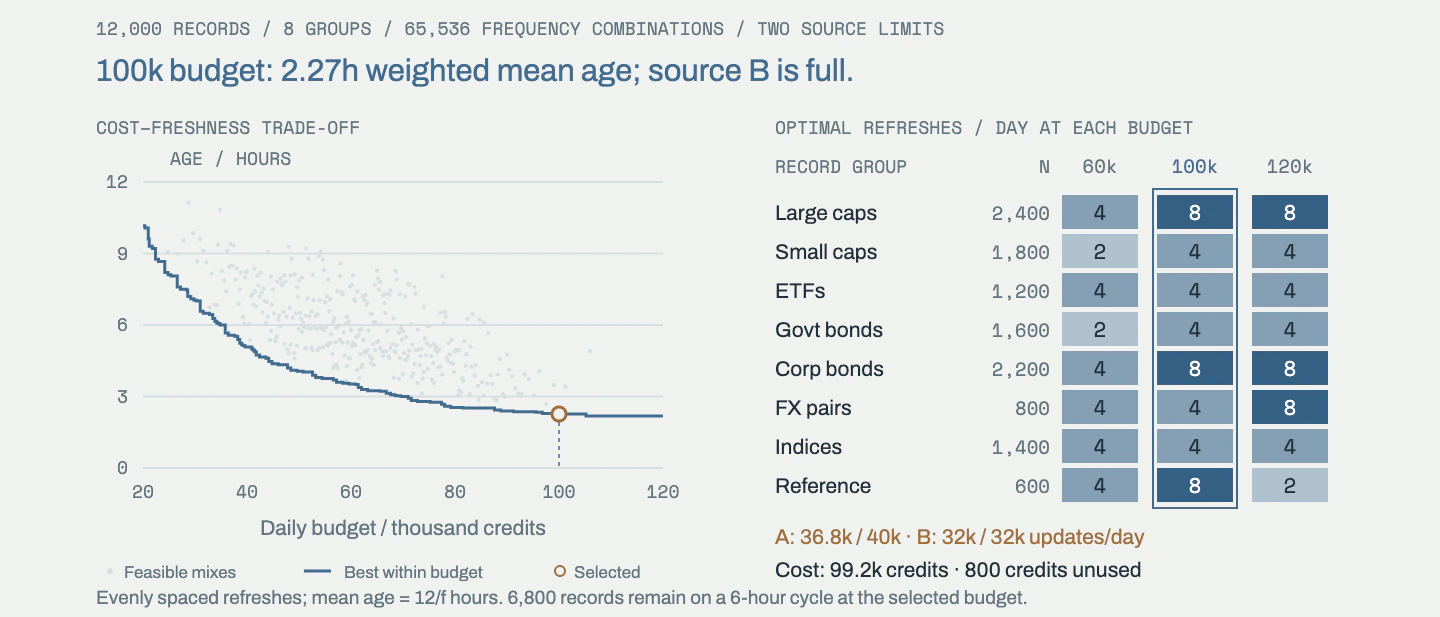
A computed cost-freshness frontier and allocation heatmap compare refresh schedules for 12000 records under group importance weights, update costs and two source caps.
Illustrative example · constructed informationFull specimen ↗
Output

An optimisation model with the proposed allocation or schedule, its constraints and sensitivity analysis.

Assessments

23

CDP evaluation ↗

An assessment of whether a customer data platform is needed and which options meet the requirements.
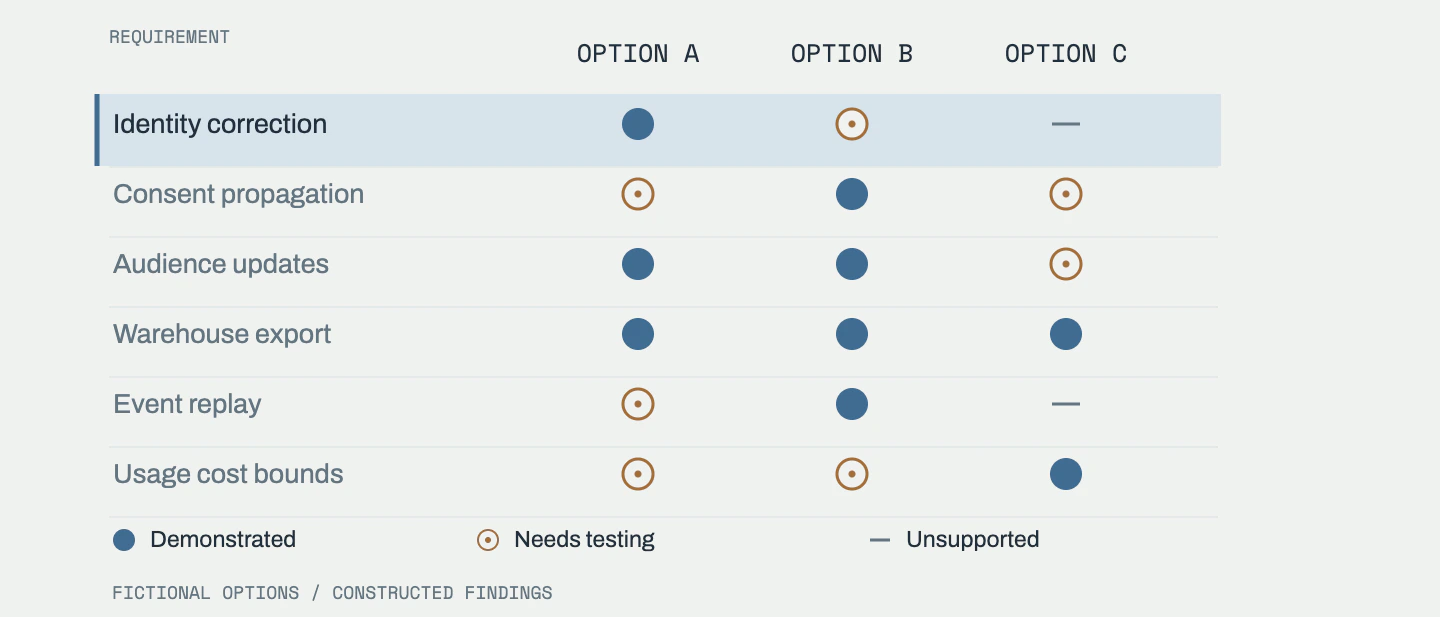
Six requirements across three fictional options, with identity correction highlighted and no aggregate ranking.
Illustrative example · constructed informationFull specimen ↗
Output

A recommendation with supporting comparisons, costs, unresolved questions and any further checks needed before a decision.

24

CRM evaluation ↗

An assessment of customer relationship management options against the company’s sales processes and data requirements.
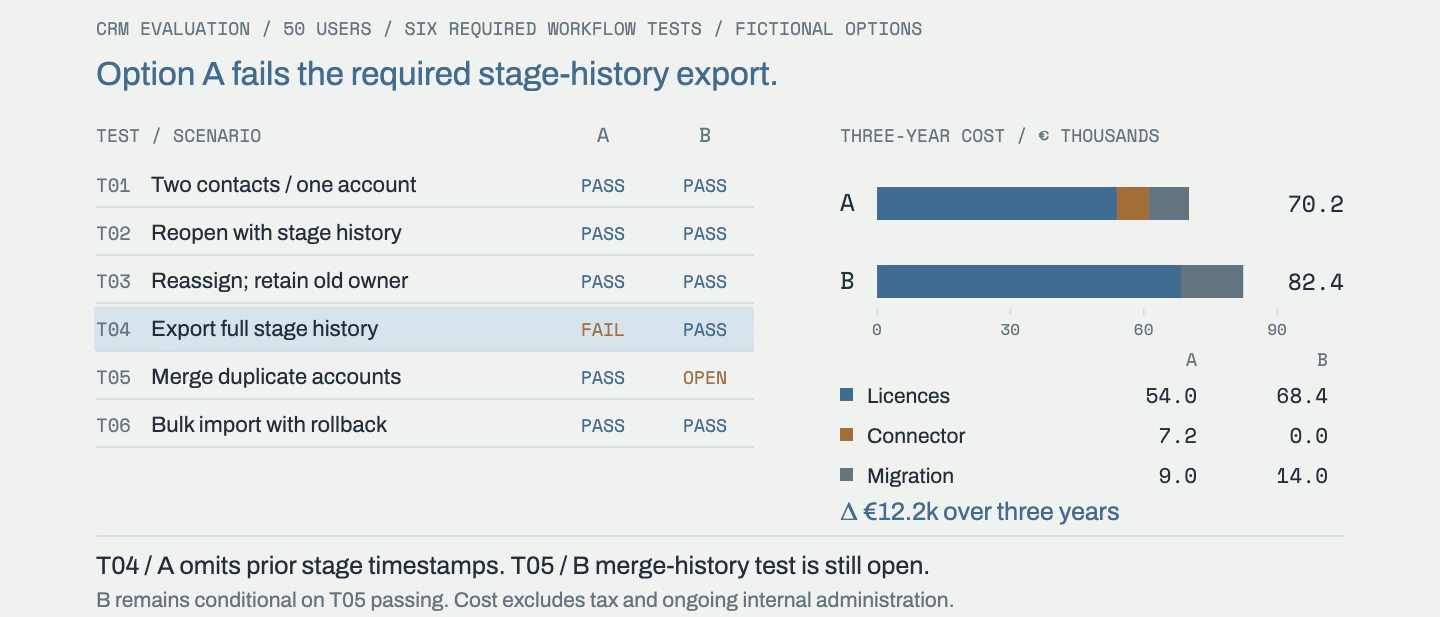
Two fictional CRM options are compared through six required scenarios and consistent three-year cost components. A fails a history requirement; B remains conditional on an unfinished merge test.
Illustrative example · constructed informationFull specimen ↗
Output

A CRM recommendation with the evidence, costs and remaining questions needed for a selection decision.

25

Capability map ↗

A comparison of the functions the business needs with what its systems and processes currently support.
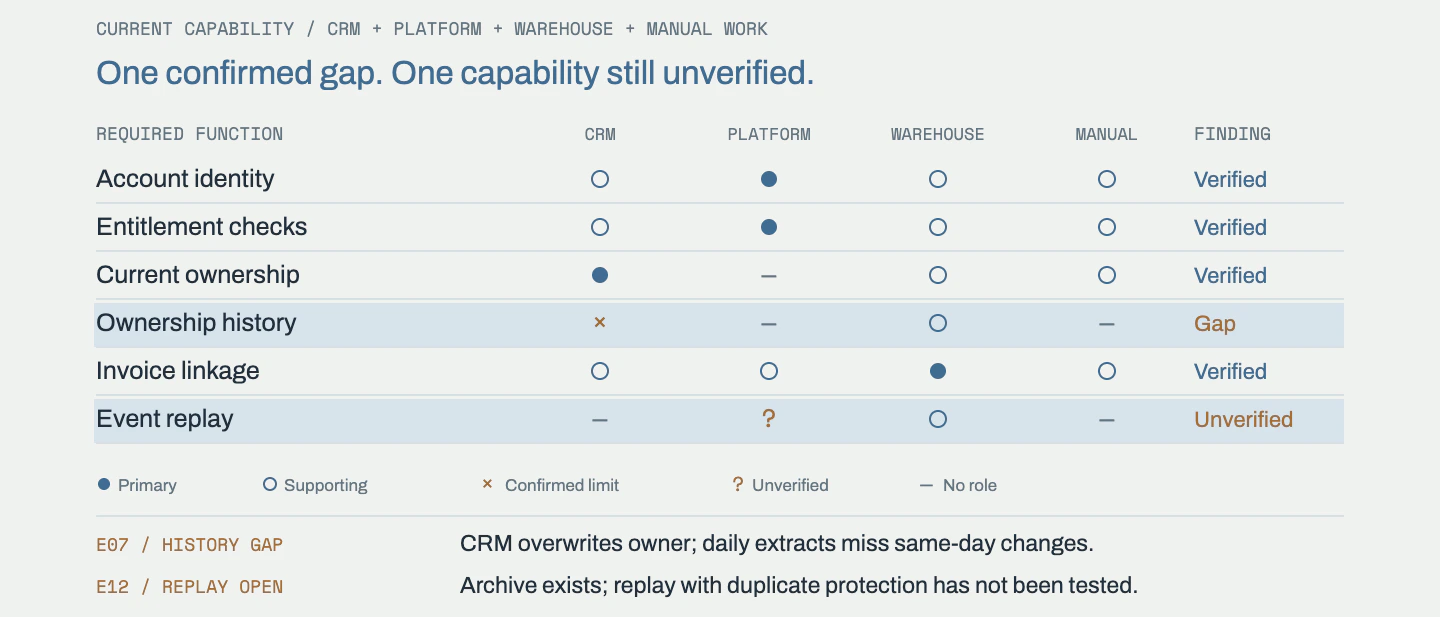
A current-system matrix distinguishes primary and supporting functions, a demonstrated ownership-history gap and an untested replay capability, with evidence notes for both.
Illustrative example · constructed informationFull specimen ↗
Output

A capability map showing current coverage, dependencies, limitations and evidence still needed.

26

Architecture decisions ↗

Decisions about how systems fit together, including warehouses, business applications and the connections between them.
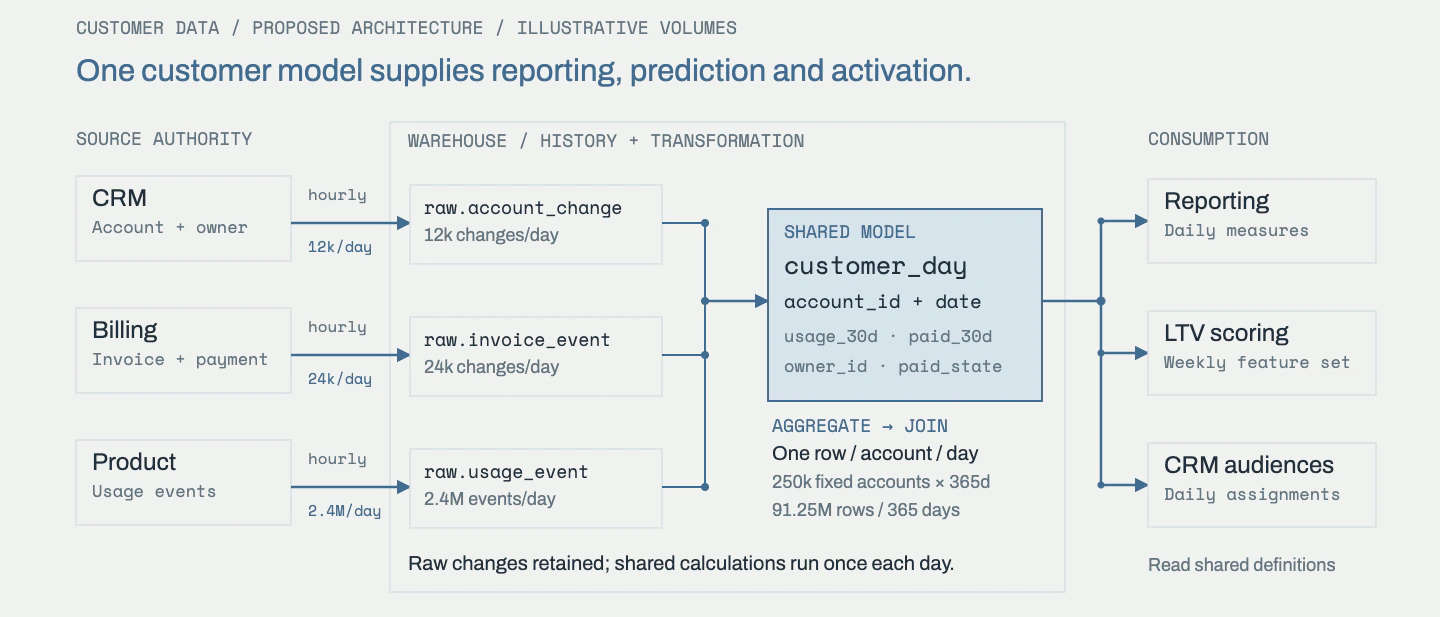
CRM, billing and product events land in separate warehouse histories. An account-ID join produces a daily customer model shared by reporting, weekly LTV scoring and daily CRM audience assignments.
Illustrative example · constructed informationFull specimen ↗
Output

A proposed system arrangement and a record of its decisions, dependencies and remaining questions.

27

Data quality review ↗

An assessment of whether the available data is suitable for its intended use.
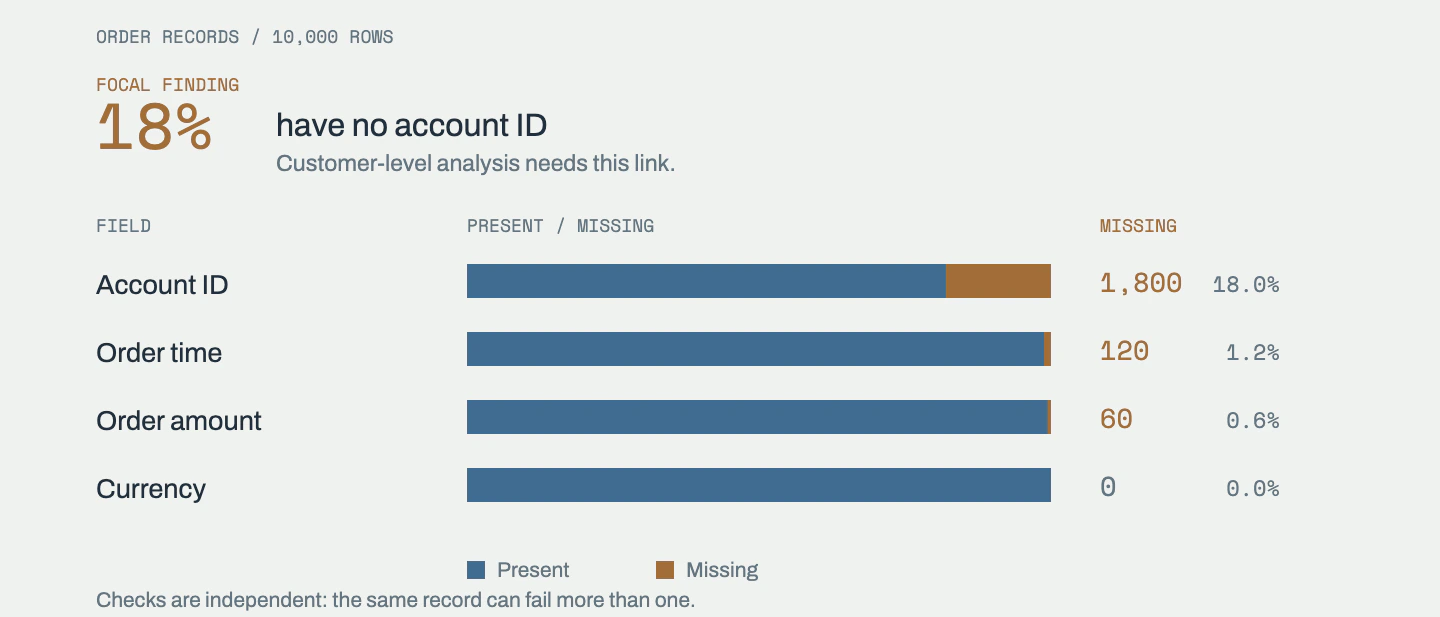
Four presence checks on 10,000 fictional orders; 1,800 lack an account ID, affecting customer-level analysis.
Illustrative example · constructed informationFull specimen ↗
Output

A review of data quality, its effects on the intended use and recommended preparation or correction work.

For an enquiry, describe the question and the systems involved.

contact@fiftystork.com ↗